The MassHunter Productivity App allows an admin to add any report method that can traditionally be used with MH Quantitative Analysis, and adds support for customization with the filtering, tagging, and user defined fields of the Productivity App. This document describes how to customize a method to take advantage of the those added functions and explains some technical details of how it is done. If you simply want to change the graphical settings of the default report methods, skip to the end of this document.
NOTE: This guide is only applicable to reports generated with python for use in MassHunter Quantitative Analysis.
This document assumes the reader has already installed the MassHunter Quant SDK and reviewed the provided documentation, such as the Reporting Developers Guide.pdf . This documentation can be found at \SDKs\Quant\Documents once installed.
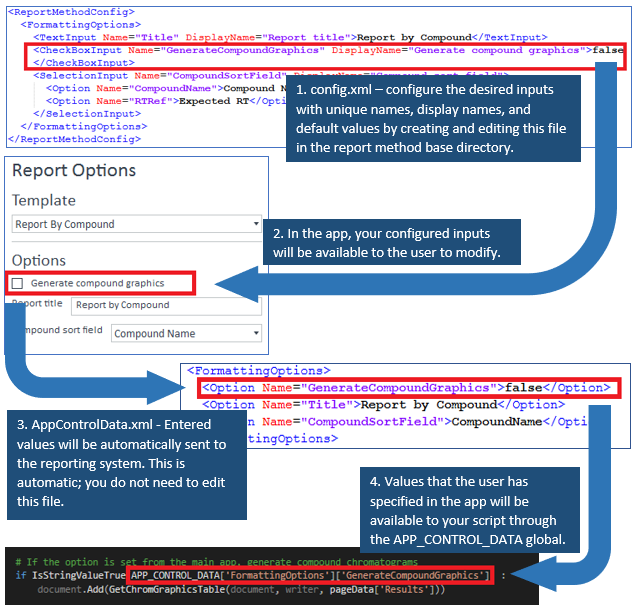
The quant reporting system is invoked by the Productivity App as a command line process. At a high level, data from the Productivity App is passed to the reporting system by XML and then parsed into a global variable (APP_CONTROL_DATA) that is accessible from within the report script environment. This data consists of the compound results that were selected for reporting in the review page, as well as their associated tag and comment data.
The app uses its own support script to provide additional global definitions and functions to load, sort, and format result data. In addition, the resource manager (used to read entries from the report’s resource file) is automatically loaded into a global variable without the need to supply the name of the resource file. For further reference, this support script is located at \Report Templates\Quant\PDF-Reporting\Codes\ProductivityReportCommon.py , and is automatically included in the script environment at runtime, so it does not need to be explicitly loaded.
Any report method can be imported into the app as long as it is supported by MH Quantitative Analysis. In order to be customized, however, the report method must reference at least one .resx file and be python based (contain at least one .py script).
Note: In addition to using the above mechanism to relay results filtering and tag information to the report method, we've also implemented a more native method that adds this information directly to the batch. When a result is selected, the corresponding TargetCompoundRow entry in the data set has its CompoundApproved flat set to true. Tag information is also added to the TargetCompoundRow UserDefined9 field in the form of an xml string.
1. Define user option variables for your script
If you want to allow users to modify variables used in your report script (e.g. the document Title), copy a config.xml file from the default report methods and put it into your report method’s base directory with the other files. The base directory of a report method is .m\DaMethod\Quant. This file contains xml entries for each variable (user option) that you wish to appear in the app while designing the report. Values that the user selects will be available for use through the APP_CONTROL_DATA global in your executing .py script. For an example, please see the report methods installed with the productivity app at \Methods\Productivity App\Report Methods.

2. Update the reporting code to use AnalyzerReportCommon.py functions, if desired
The common code script contains function and class definitions traditionally included in Utils.py and PdfPageEvent.py, additional formatting functions, as well as functions that load the APP_CONTROL_DATA, RESOURCE_MANAGER, and other globals.
3. Import your report into the App
In the admin page of the application, add your custom report method by navigating to and selecting the .m method folder. The application will scan the method to make sure it’s correctly formatted. If there are any errors, the application will inform you of them.
You can format graph and text colors (and other graphical options) for any default report method by opening the method in MH Quant as you would normally and modifying any of the below options.